Works

Agriculture Map

Scattered agricultural data, readable at a single glance.

Duration0 days
Year2026
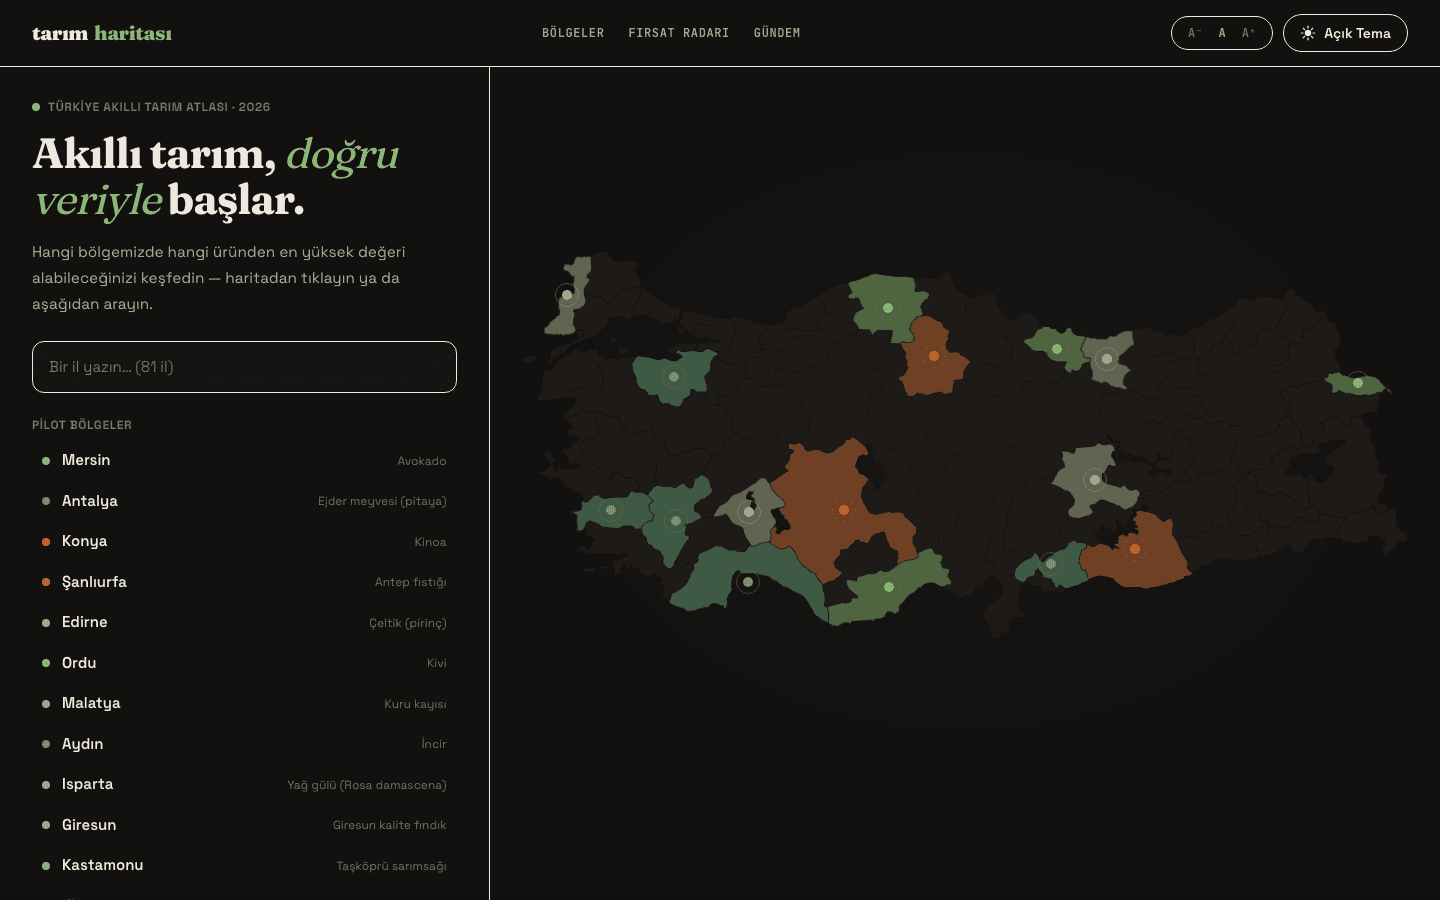
Valuable agricultural data was scattered across Excel spreadsheets, PDFs, and complex charts. This structure made it difficult for investors to read the data and make quick decisions.

I had to analyze which pieces of data formed a meaningful whole together. Climate data alone wasn't enough; when combined with water resources and economic indicators, the true picture emerged.

Data panel
Data panel

To avoid being limited by existing map plugins, I developed a custom, smoothly running map infrastructure that automatically updates in the background.

Dense data scattered across different sources has been transformed into a dynamic map that can be quickly filtered and read clearly on a single screen.

Sometimes, instead of pushing the limits of existing tools, building a custom system tailored precisely to the project's needs from scratch is a much more permanent solution.